All work

Weather Report

Installation

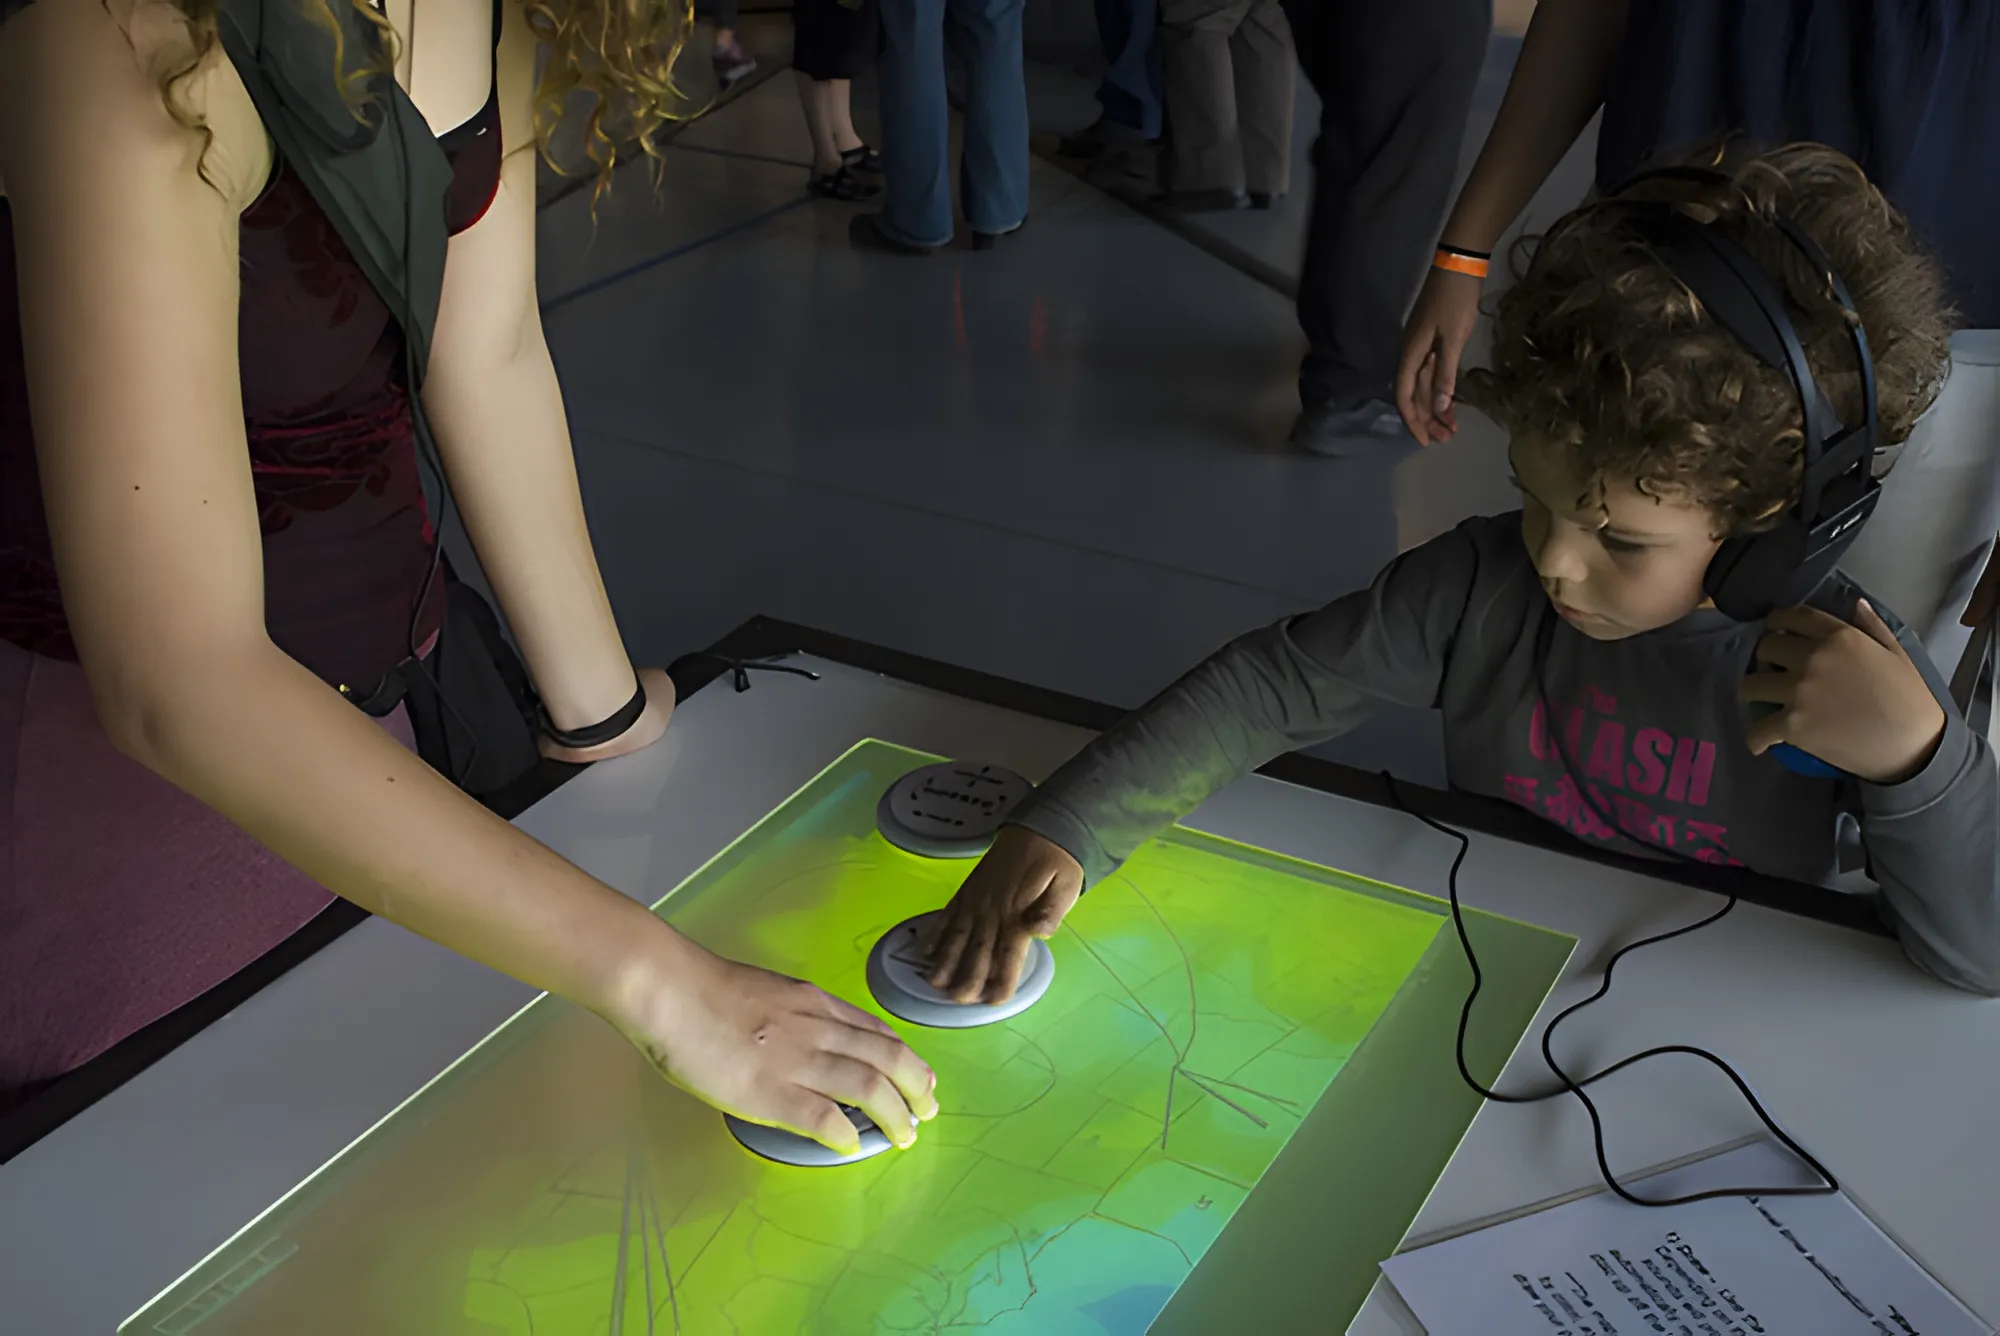
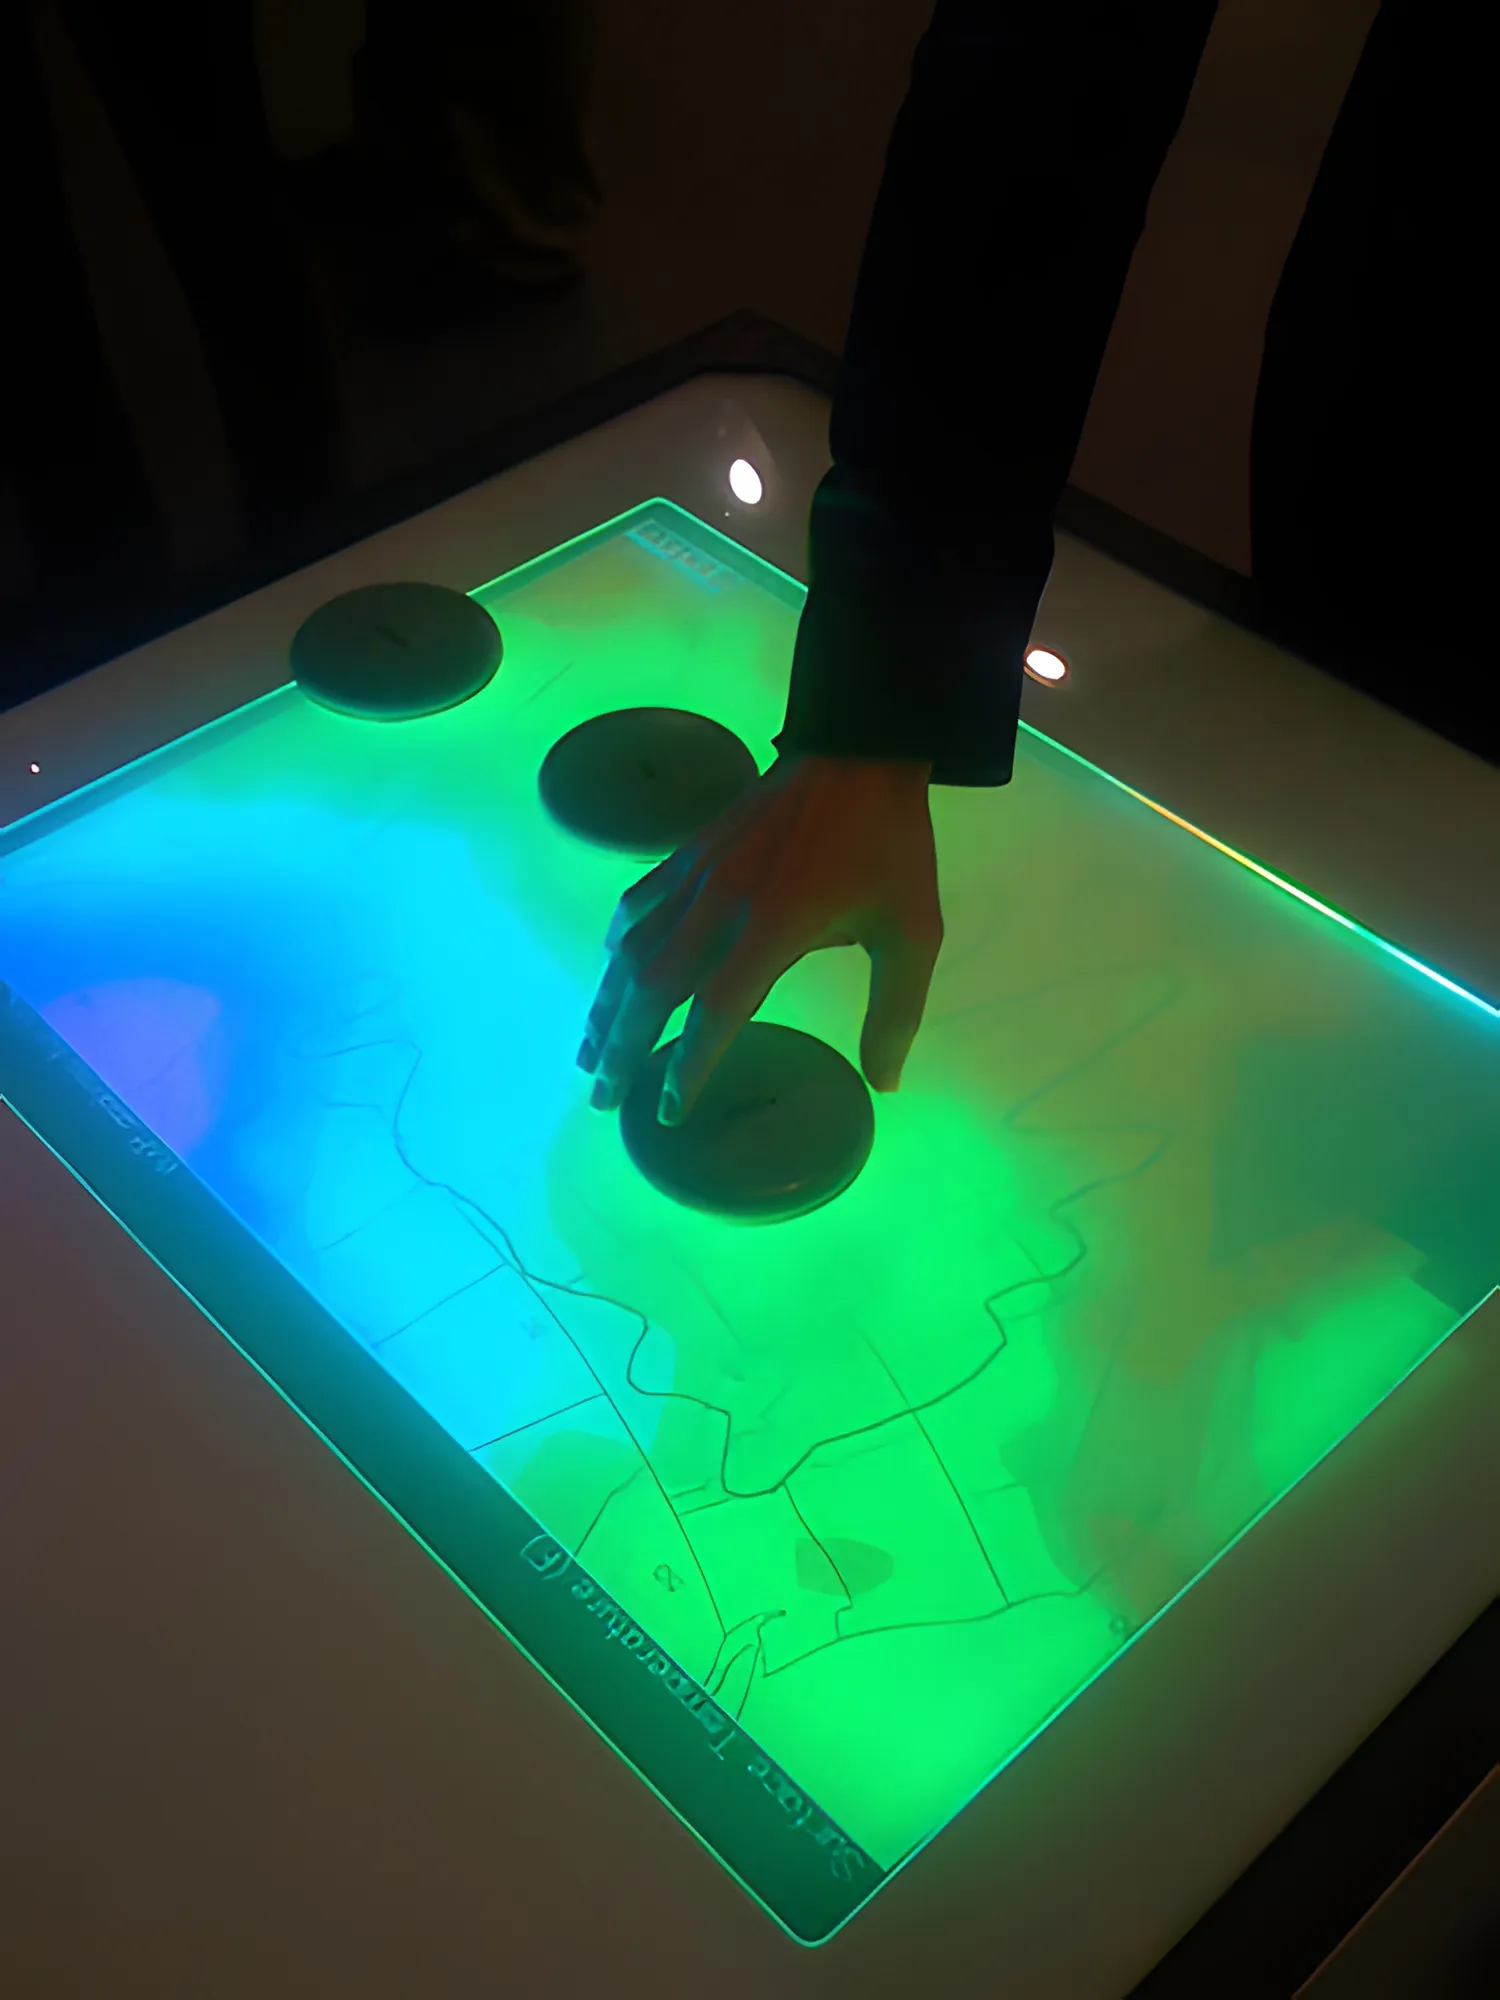
Three objects on a multi-touch table draw travel paths across a heat map of US surface temperatures. The path sets the loop structure, live temperature data shapes the processing, and rotating an object modulates the result. No two trips sound alike.

Spring 2008.
In a bright gallery, a woman and a curly-haired boy in headphones each slide a round white puck across the glowing green map on the table.
Looking down on the darkened table, one hand rests on the nearest of three dark pucks; the map beneath glows green on the right and blue-cyan on the left.

Next project

Spaces