All work

Hyper-pedagogy

Research

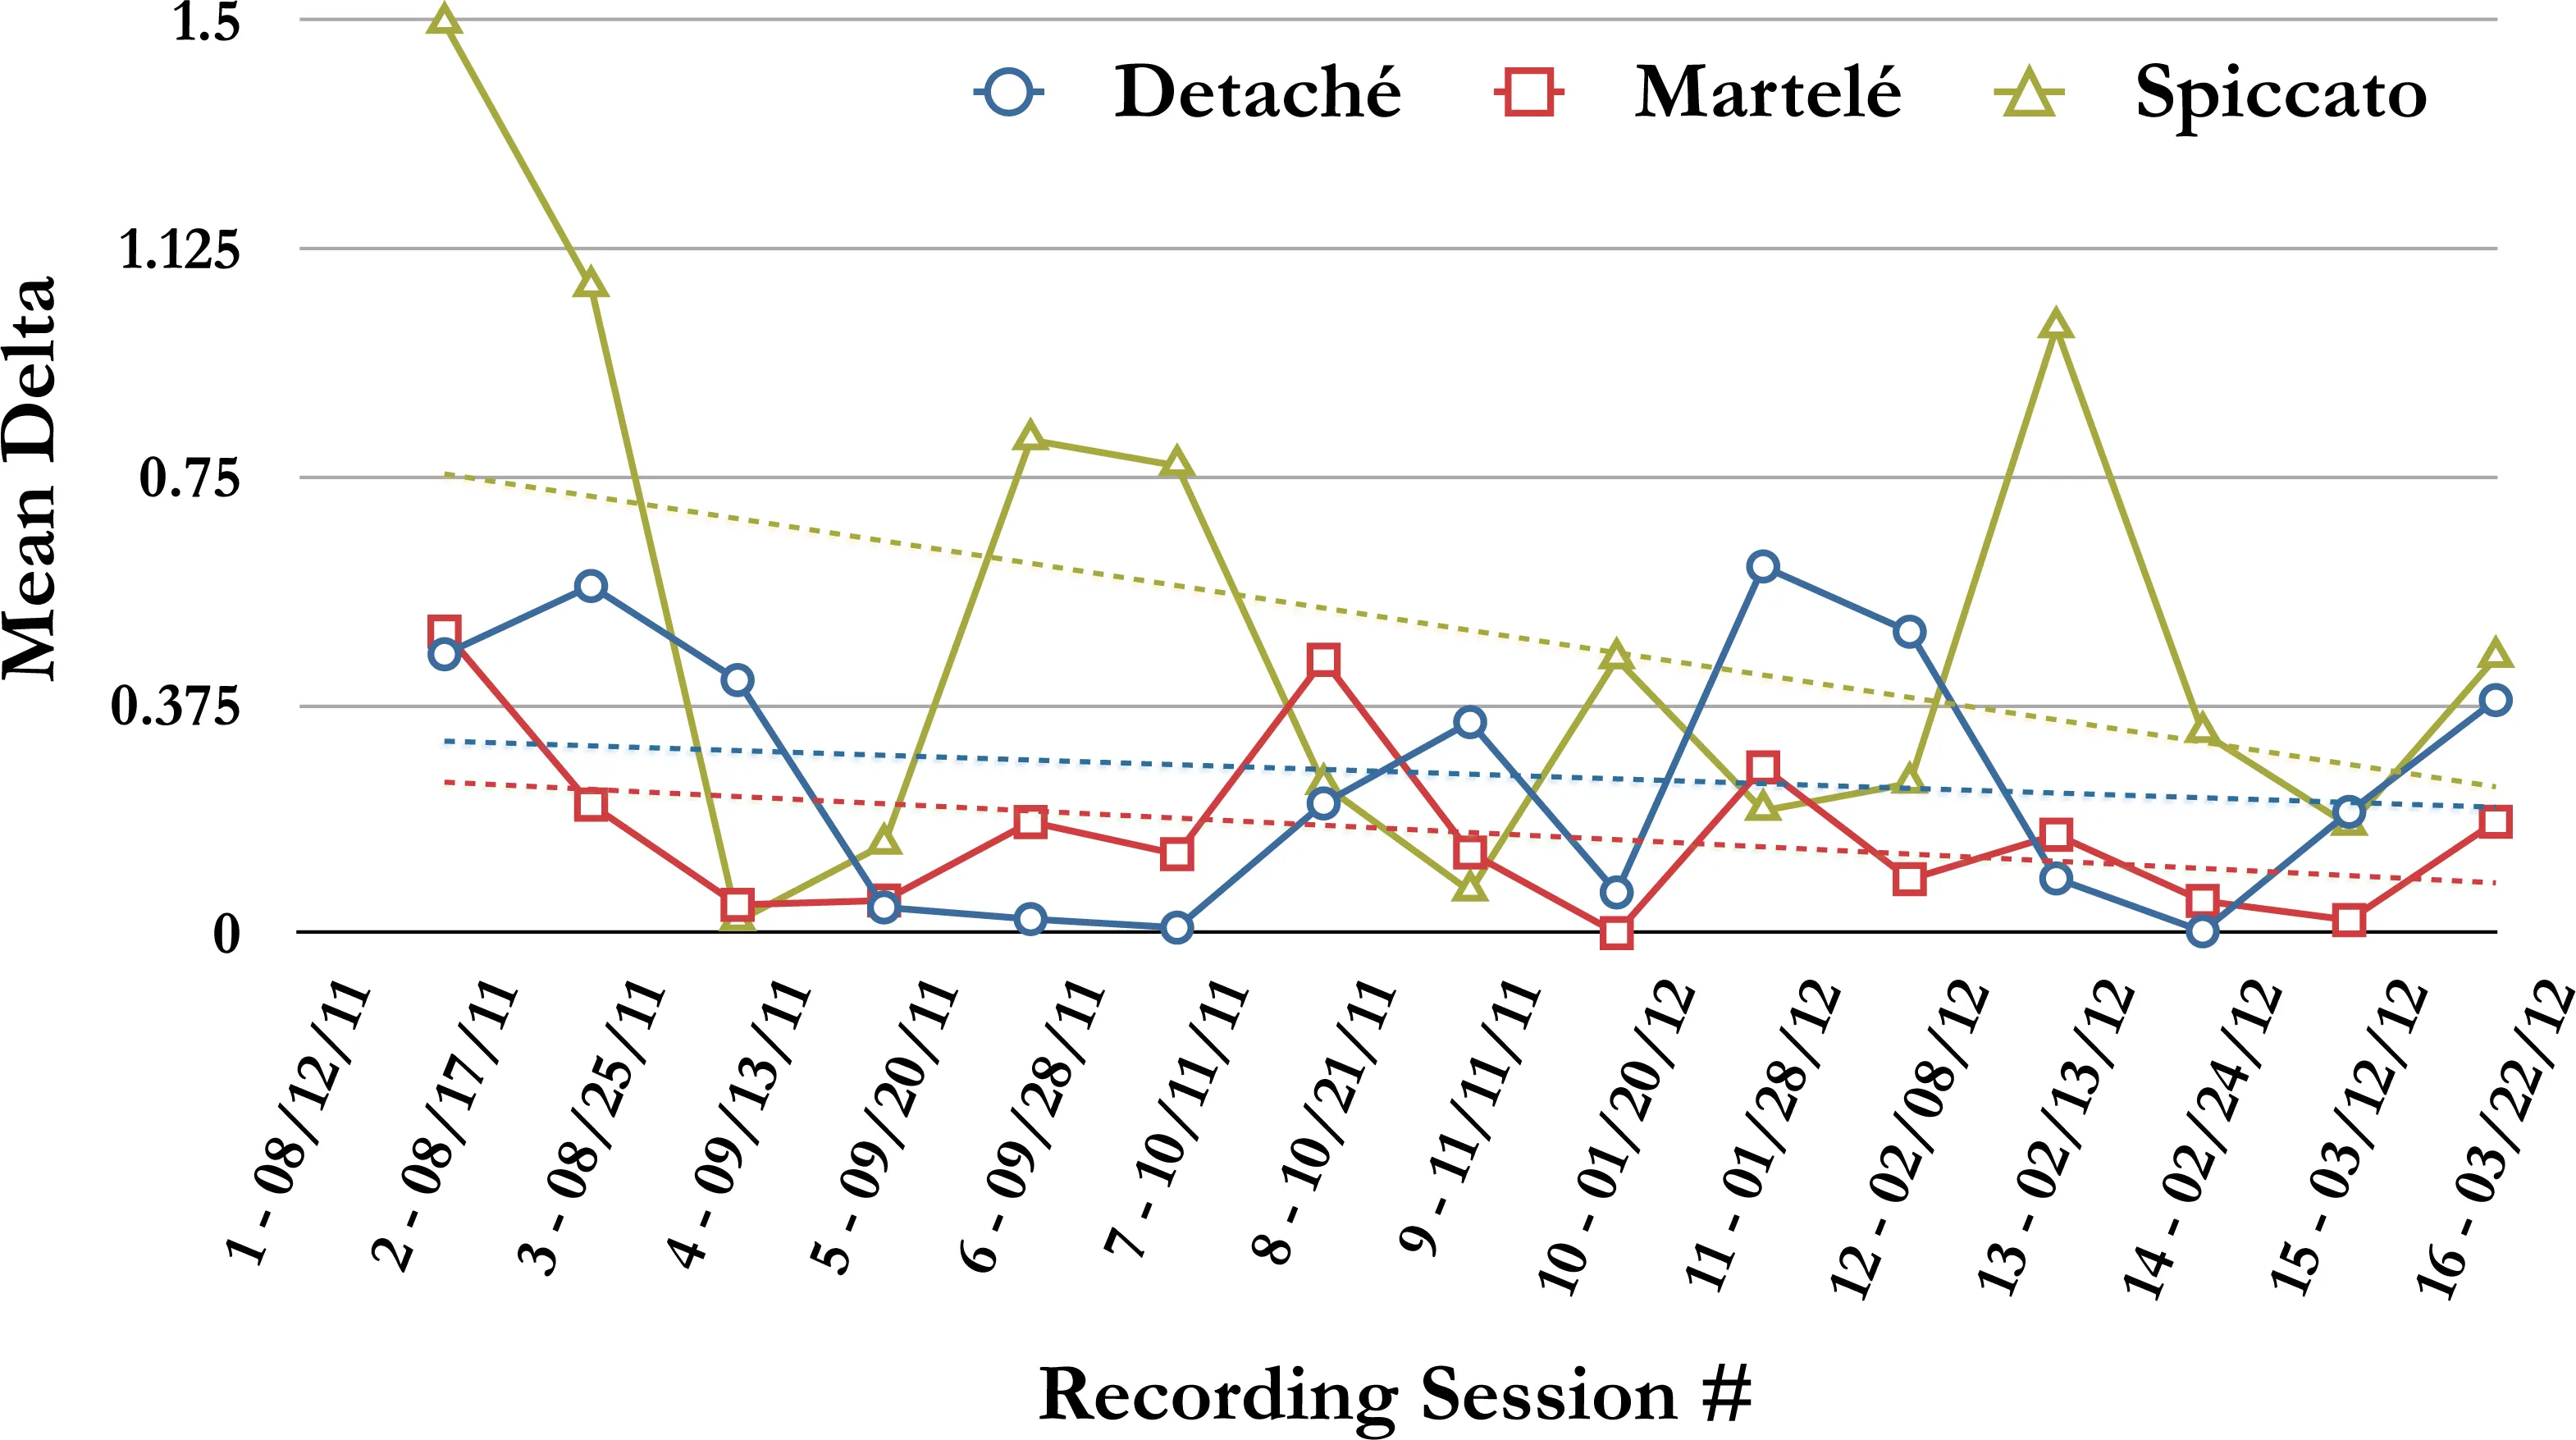
Sensor-modified instruments and multimodal analysis applied to a musician’s own practice, tracking metrics within a session and across months to visualize what changes. The charts show onset-slope deviation for détaché, martelé and spiccato bowing across sixteen recording sessions. The downward trend is a player becoming more consistent.

Line chart of mean delta against sixteen recording sessions from August 2011 to March 2012, with détaché, martelé and spiccato traces and three dotted trend lines all sloping down; spiccato is the most erratic, starting at 1.5 and spiking again at session 13.
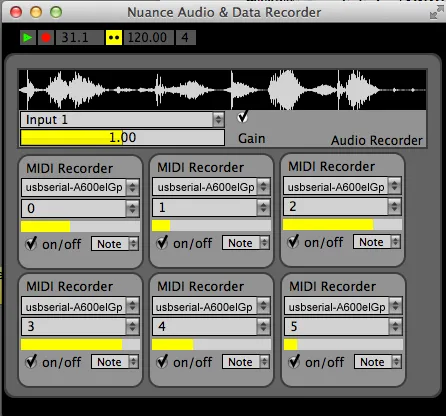
Screenshot of the Nuance Audio and Data Recorder: a transport bar above an audio waveform, an input and gain row, and six MIDI recorder panels each with a serial port menu, channel number and on/off checkbox.
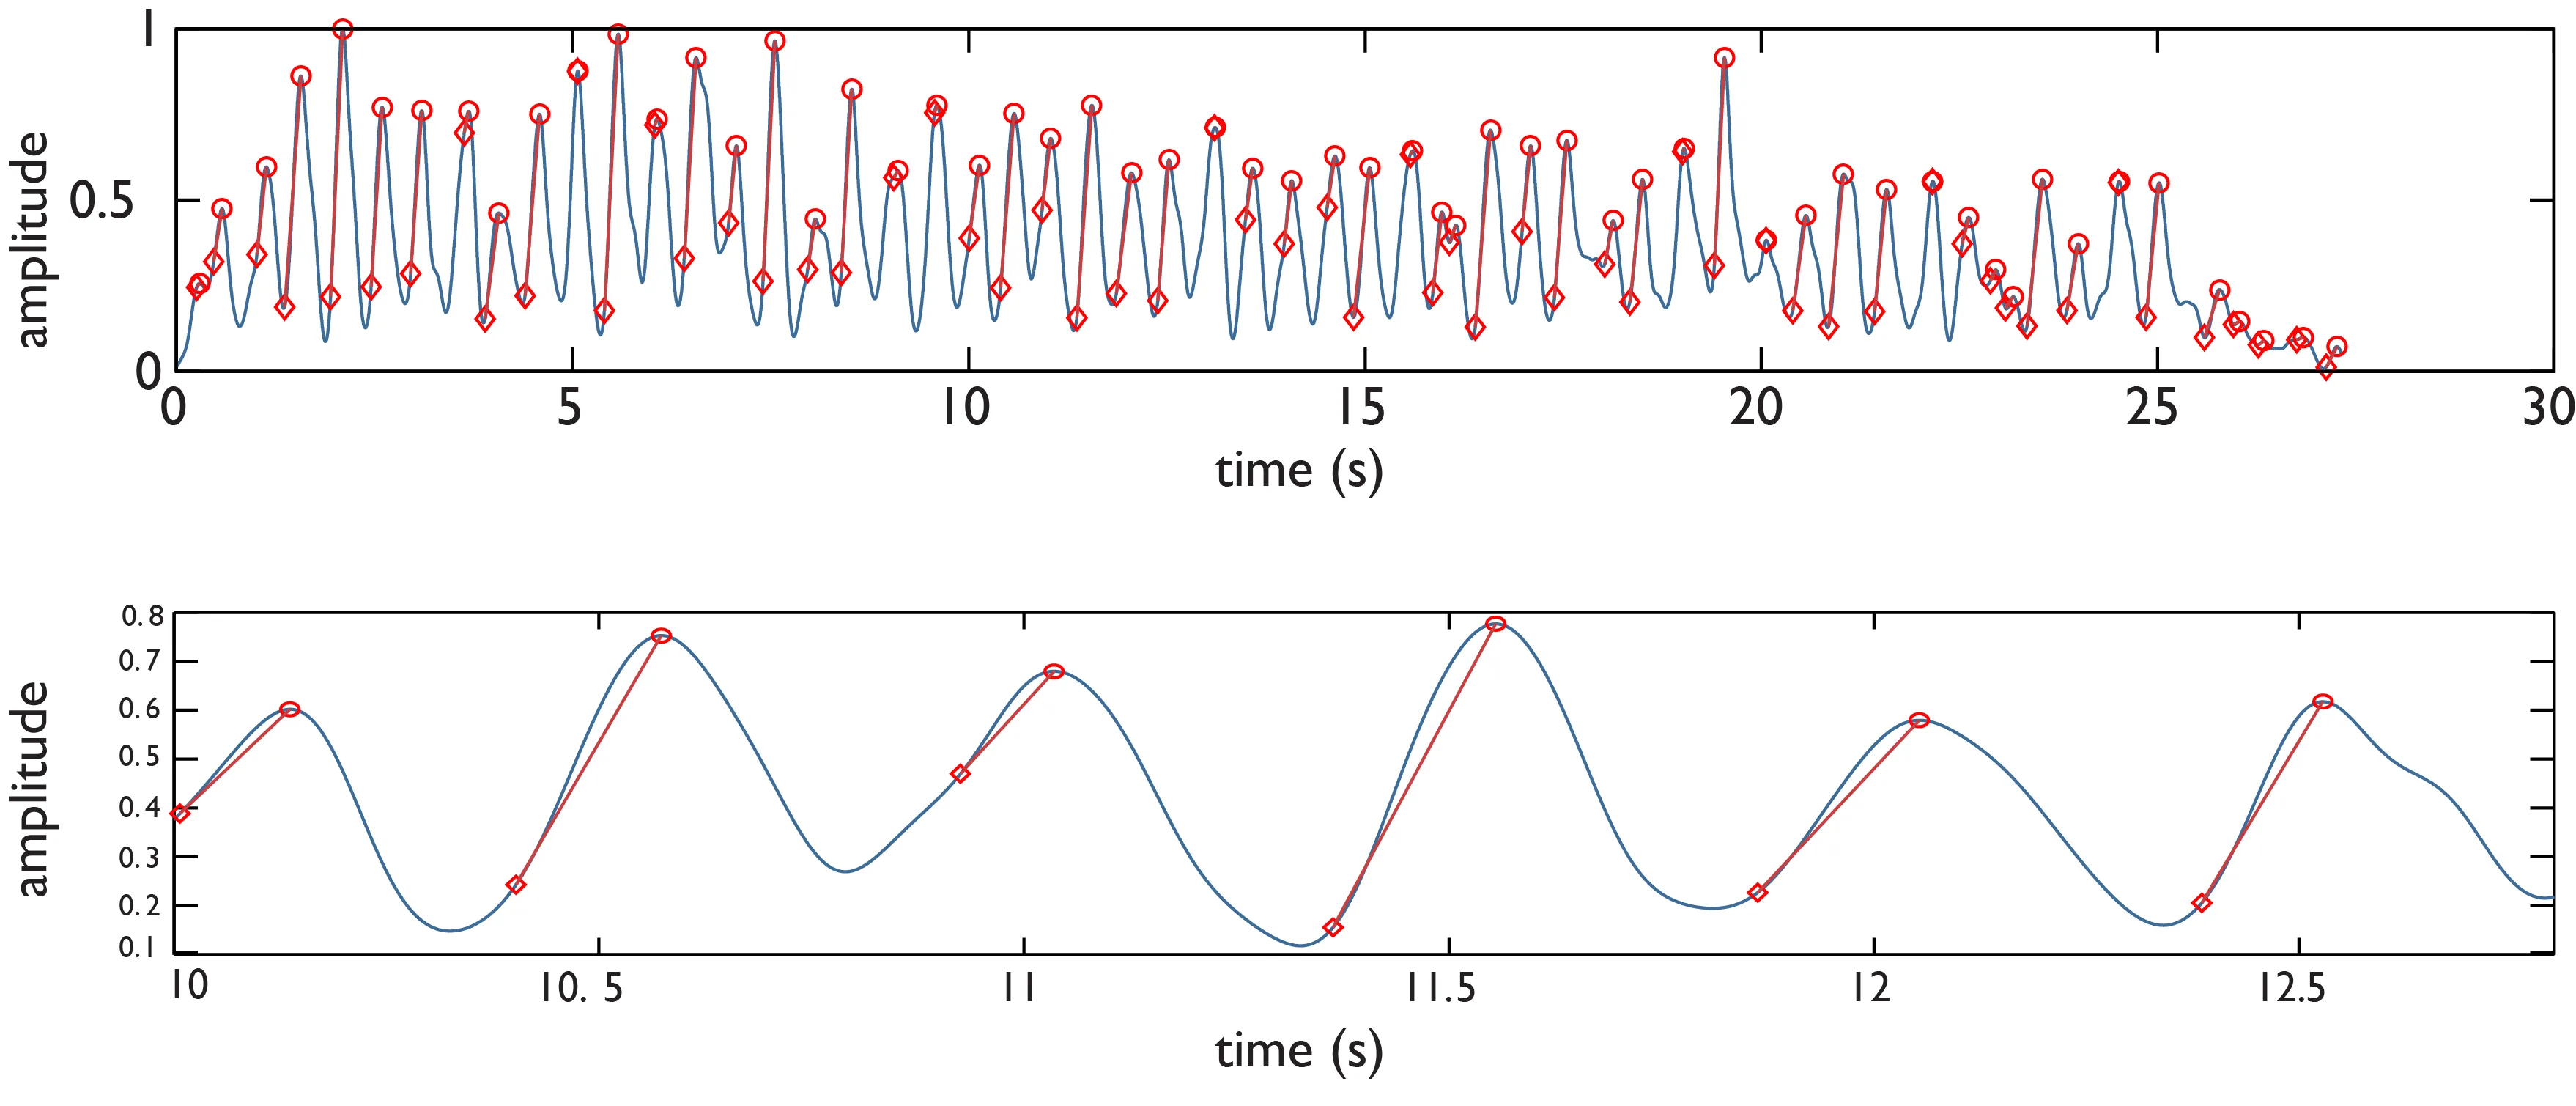
Two stacked amplitude-against-time plots. The upper spans thirty seconds of playing, every note peak marked with a red circle and its rise marked from a diamond at the trough; the lower zooms into seconds 10 to 12.5, where six such rises are drawn as straight red lines across the curve.
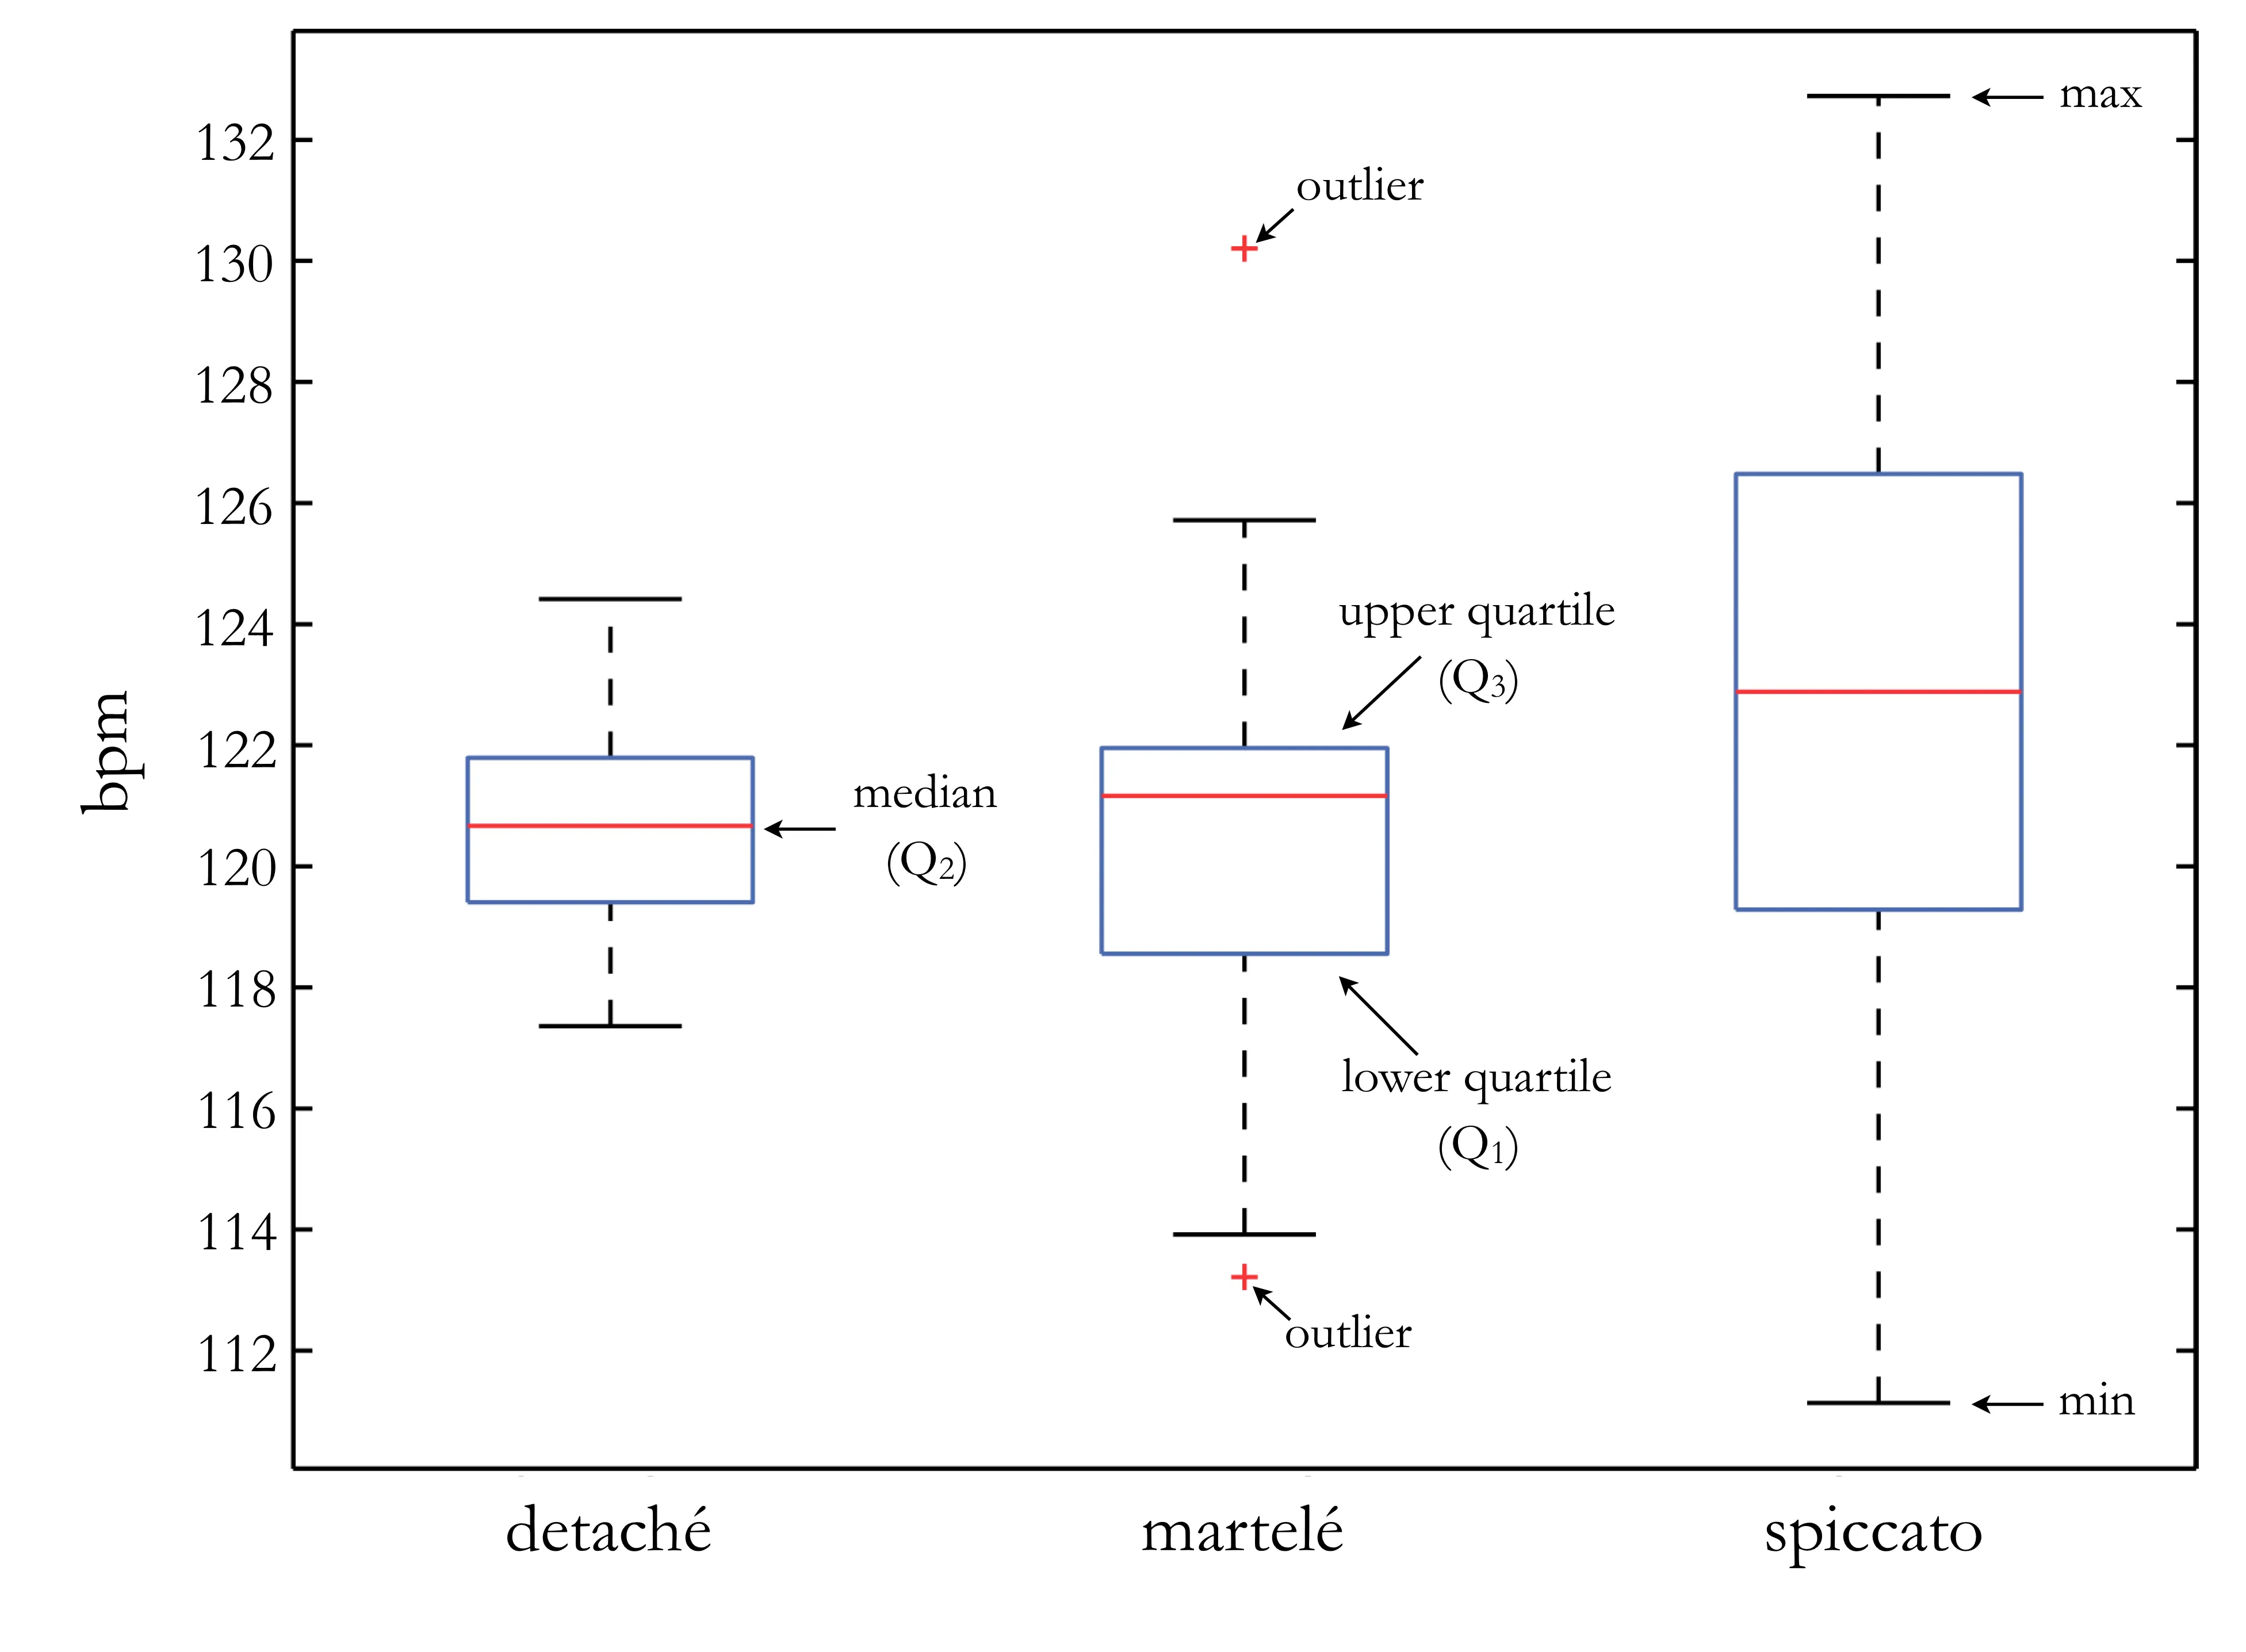
Box-and-whisker plot of tempo in bpm for détaché, martelé and spiccato, labelled with median, quartiles, whiskers and outliers. Détaché is the tightest box around 120.7, martelé similar but with outliers near 130 and 113, spiccato far wider and centred higher at 123.

Next project

Plotter Art